Analyst · Work sample: fictional scenario, synthetic data
Clean a messy sales export and build a one-page dashboard
A messy weekly sales export cleaned in 11 logged steps, then shown as a one-page dashboard with a covering email.
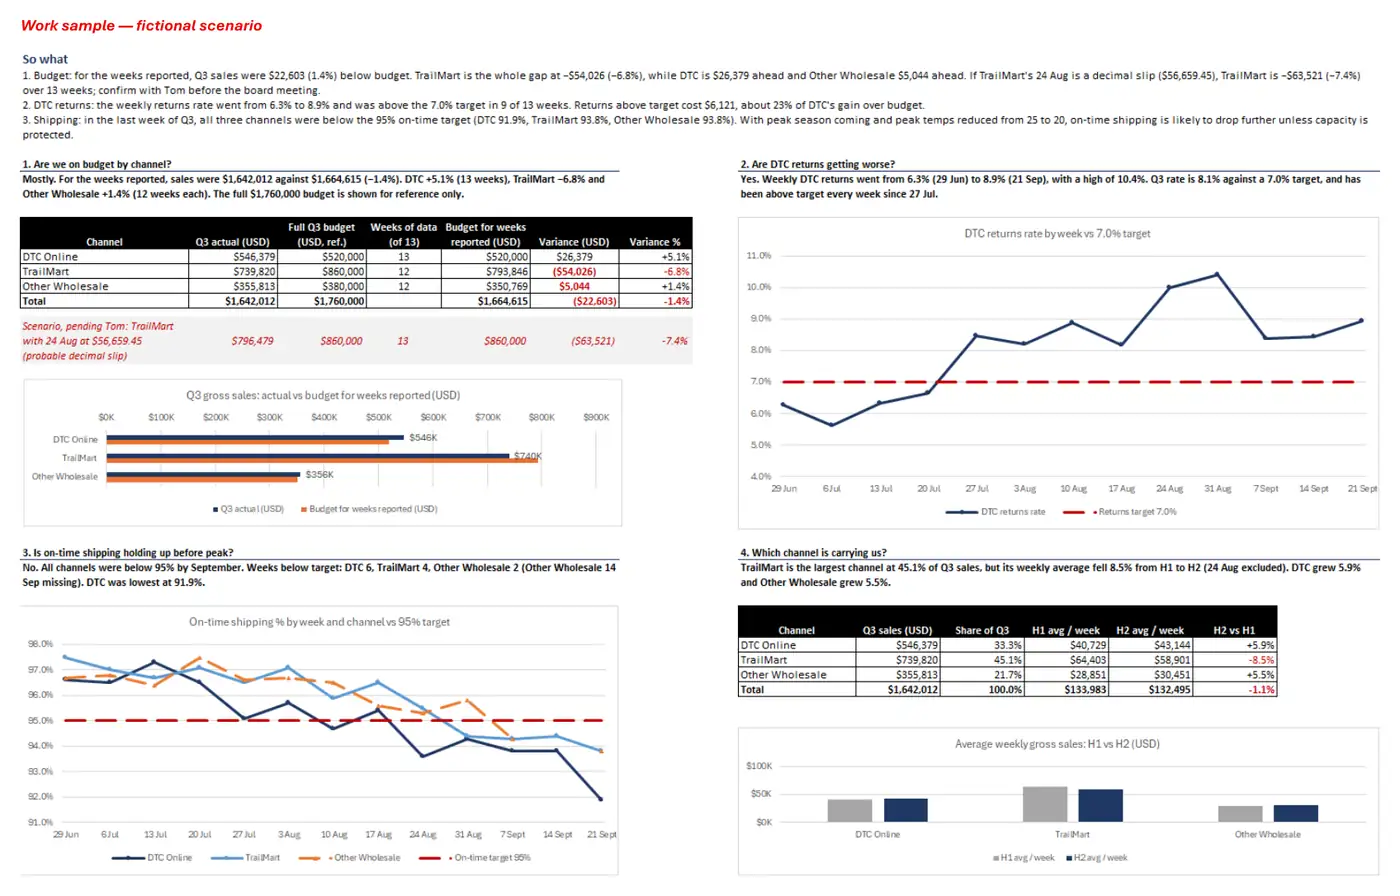
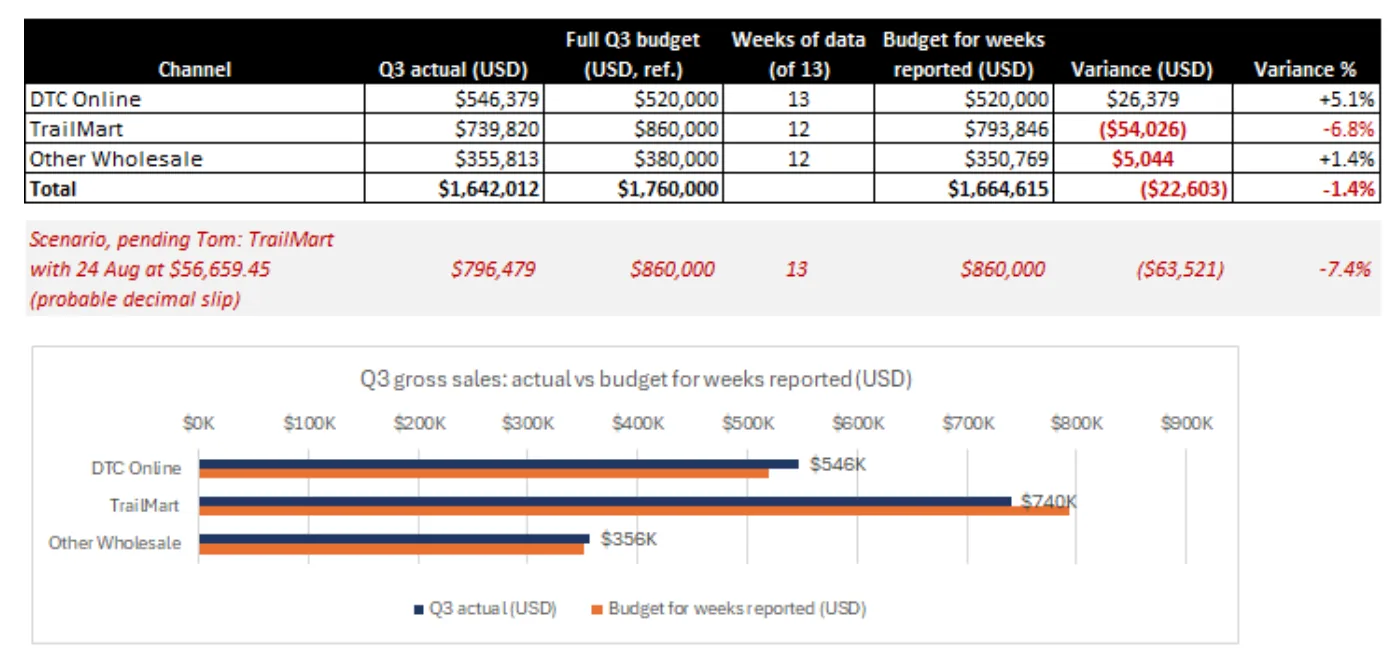
Fixed 11 data problems and showed that, on the weeks reported, Q3 sales were $22,603 (1.4%) under budget.
- Time taken
- 2 h
- Tools
- Excel
- AI used
- Claude
- Skills
- Data cleaning, Excel and Power Query, KPI reporting, Dashboard design
- Date
As it arrived
I need one page on Q3 for Monday's leadership meeting. Four things: are we on budget by channel, are DTC returns getting worse, is on-time shipping holding up before peak, and which channel is carrying us. Tom's export is messy, so clean it first and tell me what you fixed. Keep it to one page. Monday 8:00 AM ET at the latest.
Quick look
Deliverables
The details
Never overwrite the raw data, and flag gaps instead of filling them.
Deadline: Monday 8:00 AM ET at the latest.
My approach
I kept the raw export untouched and cleaned a copy, logging every change. The cleaning log lists 11 problems:
- Sales values stored as text, one with a dollar sign and a thousands comma inside it.
- One date in a different format from all the others.
- “Trailmart” and “DTC online “ (with a trailing space) written differently from the channel names used elsewhere.
- On-time shipping percentages on two scales (96.6 against 0.951).
- A TrailMart week that appeared twice with identical values, so I removed one.
- A TrailMart sales figure about ten times a normal week while the order count was normal. I kept it out of the headline and showed a corrected view separately, flagged as a probable decimal slip.
- A negative returns value, excluded and not corrected.
- A missing Other Wholesale week, added as a flagged blank and not estimated.
- A budget table that came with the export, used as the dashboard’s budget inputs.
The hardest call was the TrailMart figure of $566,594.50. The 142 orders were a normal week and the number is exactly $56,659.45 with the decimal shifted one place, so I did not let it distort the headline.
What I delivered
- Raw (untouched): the export as it arrived.
- Clean: the cleaned data.
- Cleaning log: the 11 problems and what I did about each.
- Dashboard: four questions answered on one page (budget by channel, DTC returns, on-time shipping before peak, which channel is carrying sales), plus a “So what”.
- Covering email: a five-sentence draft to Dana.
What I’d do with more time
Rebuild the cleaning in Power Query so every step is recorded and repeatable for Q4, and ask for an export with a fixed number format.
How I used AI
Claude created this practice simulation. I used Claude in Excel to work faster, directing the work and reviewing everything it produced.